Fichier:Vee diagram-exemple.png
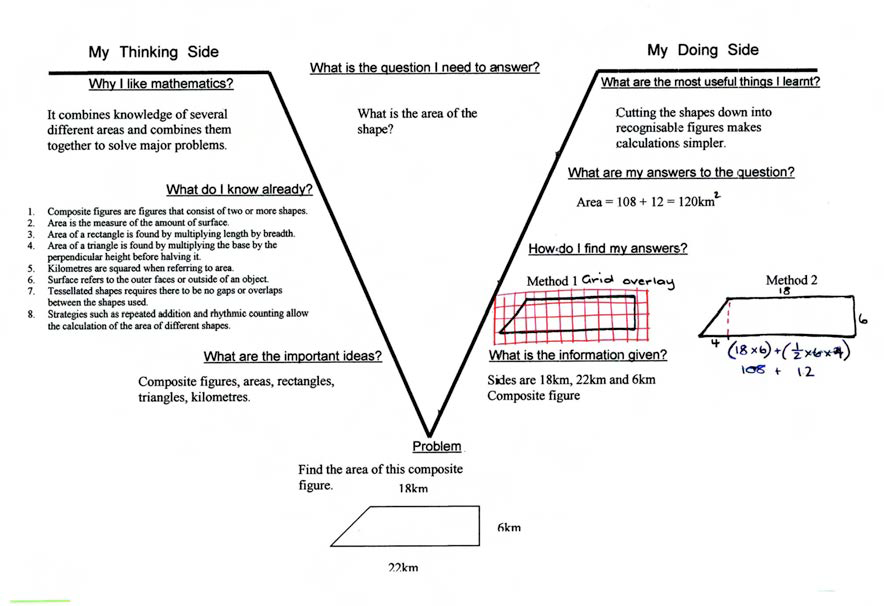
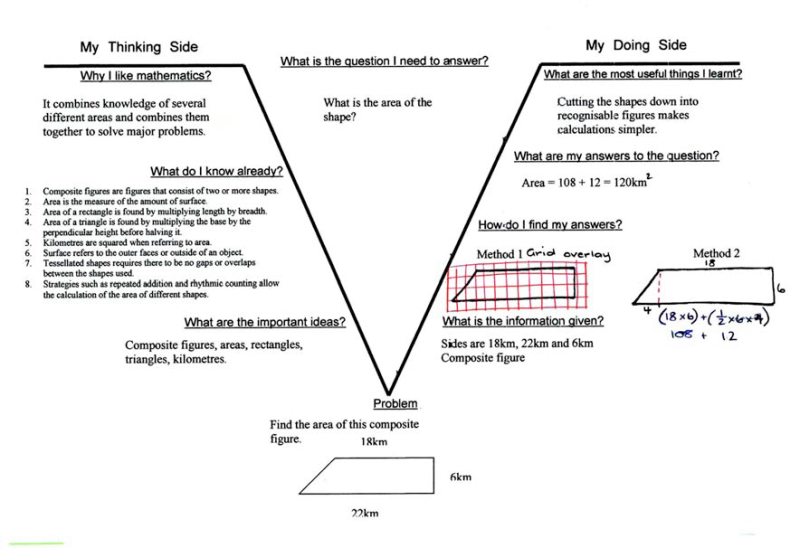
Révision datée du 17 février 2014 à 09:53 par Dlamy (discussion | contributions) (Afamasaga-Fuata’i, K. (2007). Using concept maps and vee diagrams to interpret “area” syllabus outcomes and problems. In ''Mathematics essential for learning, essential for life. Proceedings of the 21st biennial conference of the Australian Associat)
Taille de cet aperçu : 800 × 548 pixels. Autres résolutions : 320 × 219 pixels | 884 × 606 pixels.
Fichier d’origine (884 × 606 pixels, taille du fichier : 247 Kio, type MIME : image/png)
Afamasaga-Fuata’i, K. (2007). Using concept maps and vee diagrams to interpret “area” syllabus outcomes and problems. In Mathematics essential for learning, essential for life. Proceedings of the 21st biennial conference of the Australian Association of Mathematics Teachers, Inc (pp. 109).
Historique du fichier
Cliquer sur une date et heure pour voir le fichier tel qu'il était à ce moment-là.
| Date et heure | Vignette | Dimensions | Utilisateur | Commentaire | |
|---|---|---|---|---|---|
| actuel | 17 février 2014 à 09:53 | | 884 × 606 (247 Kio) | Dlamy (discussion | contributions) | Afamasaga-Fuata’i, K. (2007). Using concept maps and vee diagrams to interpret “area” syllabus outcomes and problems. In ''Mathematics essential for learning, essential for life. Proceedings of the 21st biennial conference of the Australian Associat |
Vous ne pouvez pas remplacer ce fichier.
Utilisation du fichier
La page suivante utilise ce fichier :