Différences entre versions de « Diagramme Vee »
| Ligne 48 : | Ligne 48 : | ||
== Bibliographie == | == Bibliographie == | ||
| − | Afamasaga-Fuata’i, K. (2007). Using concept maps and vee diagrams to interpret “area” syllabus outcomes and problems. In Mathematics essential for learning, essential for life. ''[http://dbz124.dbinformatics.com.au/content/download/19064/252041/file/essential.pdf#page=110 Proceedings of the 21st biennial conference of the Australian Association of Mathematics Teachers,] | + | Afamasaga-Fuata’i, K. (2007). Using concept maps and vee diagrams to interpret “area” syllabus outcomes and problems. In Mathematics essential for learning, essential for life. ''[http://dbz124.dbinformatics.com.au/content/download/19064/252041/file/essential.pdf#page=110 Proceedings of the 21st biennial conference of the Australian Association of Mathematics Teachers, Inc]'', p. 102-111. <br/> |
Alvarez, M. C., & Risko, V. J. (2007). [http://library3.tnstate.edu/library/eresearch/ttl/tlfive.pdf The Use Of Vee Diagrams With Third Graders As A Metacognitive Tool For Learning Science Concepts].<br /> | Alvarez, M. C., & Risko, V. J. (2007). [http://library3.tnstate.edu/library/eresearch/ttl/tlfive.pdf The Use Of Vee Diagrams With Third Graders As A Metacognitive Tool For Learning Science Concepts].<br /> | ||
Version du 17 février 2014 à 10:07
Appellation en anglais
V Diagram
Vee Diagram
Stratégies apparentées
Carte conceptuelle,
Carte de connaissances,
Schéma heuristique
Type de stratégie
Microstratégie
Domaine d’apprentissage
Connaissances conceptuelles. Connaissances métacognitives.
Description
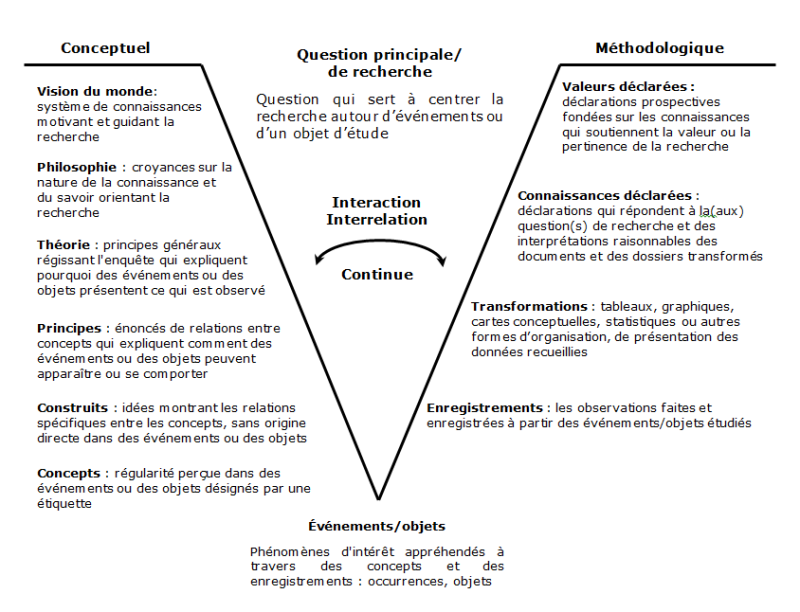
Adapté de Alvarez, M. C., & Risko, V. J. (2007). Traduction de l'auteur
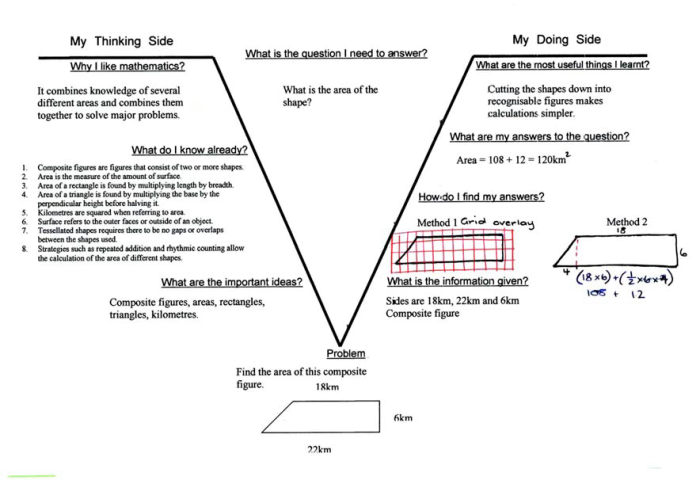
Un exemple d'utilisation au primaire, le calcul de l'aire d'une figure:
Vee diagram of a problem, Afamasaga-Fuata’i (2007, p. 109)
Conditions favorisant l’apprentissage
Identifier, expliquer et justifier les conditions d’apprentissage que la stratégie vise à favoriser. Décrire quelle est la preuve empirique de l’efficacité de la stratégie.
Niveau d’expertise des apprenants
Identifier si la stratégie est adaptée aux apprenants débutants, intermédiaires ou novices dans un domaine. Décrire comment la stratégie prend en considération le niveau des connaissances des apprenants dans le domaine ciblé. Donner des exemples.
Type de guidage
Décrire quel est le type de guidage et de support offert par la stratégie. Faire les liens avec le niveau d’expertise des apprenants en décrivant comment et pourquoi le type offert est censé favoriser l’apprentissage de ces apprenants.
Type de regroupement des apprenants
Décrire le type de regroupement préconisé par la stratégie et comment on peut le réaliser. Donner des exemples.
Milieu d’intervention
Décrire dans quel milieu éducatif la stratégie a été utilisée. Donner des exemples.
Conseils pratiques
Dans la mesure du possible, fournir des conseils, des « trucs » ou des « astuces » en lien avec des exemples issus de la pratique « réelle » de cette stratégie.
Bibliographie
Afamasaga-Fuata’i, K. (2007). Using concept maps and vee diagrams to interpret “area” syllabus outcomes and problems. In Mathematics essential for learning, essential for life. Proceedings of the 21st biennial conference of the Australian Association of Mathematics Teachers, Inc, p. 102-111.
Alvarez, M. C., & Risko, V. J. (2007). The Use Of Vee Diagrams With Third Graders As A Metacognitive Tool For Learning Science Concepts.
Calais,J.G. (2009).The Vee Diagram as a Problem Solving Strategy: Content Area Reading/Writing Implications. National Forum Teacher Education Journal,19, 3,1-6.
Evren, A., Bati, K., & Yilmaz, S. (2012). The Effect of using v-diagrams in Science and Technology Laboratory Teaching on Preservice Teachers’ Critical Thinking Dispositions. Procedia-Social and Behavioral Sciences, 46, 2267-2272.
Fox, R. (2007). Gowin's Knowledge Vee and the integration of philosophy and methodology: a case study. Journal of Geography in Higher Education, 31(2), 269-284. Repéré à: http://eprints.ru.ac.za/821/1/FoxVEEpaperPrePrint.pdf
Gowin, B., & Alvarez, M.C. (2005). The art of educating with v diagrams. Cambridge, MA: Cambridge University Press.<br /
Keleş, O. & Özsoy, S.(2009).Pre-service teachers’ attitudes toward use of Vee diagrams in general physics laboratory. International Electronic Journal of Elementary Education, 1(3)
Knaggs, C.M & Schneider, R.M.(2012). Thinking Like a Scientist: Using Vee-Maps to Understand Process and Concepts in Science. Research in Science Education, 42, 609-632.
Novak, J. (1990). Concept maps and Vee diagrams: two metacognitive tools to facilitate meaningful learning. Instructional Science, 19(1), 29-52.
Novak, J. D., & Gowin, D. B. (1984). Learning how to learn. Cambridge, USA: Cambridge University Press.
Passmore, G.G.(1998).Using Vee Diagrams to facilitate meaningful learning and misconception remediation in radiologic technologies laboratory education. Radiologic Science & Education,4(1), 11-2
Wheeldon,J. & Ahlberg, M.K.(2011).Visualizing Social Science Research: Maps, Methods, & Meaning. Thousands Oaks, CA: Sage Publications.
Zohar, A., & Barzilai, S. (2013). A review of research on metacognition in science education: current and future directions. Studies in Science Education, 1-49.
Webographie
Description de l'utilisation de diagramme de Vee sur le site de Tennessee Curriculum Center. En ligne :
http://www.tncurriculumcenter.org/resources/38:vee-diagram
Présentation de la création des diagrammes sous forme de V avec PowerPoint. En ligne: http://www.presentation-process.com/v-diagram.html#.Un0MWflLO3g
What is vee diagram? sur le site Pictureitsolved. En ligne: http://pictureitsolved.com/resources/practices/vee-diagrams/
État d’avancement de la fiche > Toutes les fiches
Avancée
Conditions favorisant l’apprentissage > Réguler
Conditions favorisant l’apprentissage > Structurer
Milieu d’intervention > École primaire
Milieu d’intervention > École secondaire
Milieu d’intervention > Autre
Milieu d’intervention > Milieu de travail
Milieu d’intervention > Préuniversitaire
Milieu d’intervention > Universitaire
Niveau d’expertise des apprenants > Intermédiaires
Type de guidage > Guidée/soutenue par les experts/enseignants
Type de regroupement des apprenants > Grand groupe
Type de regroupement des apprenants > Individuel
Type de regroupement des apprenants > Petit groupe
Type de stratégie > Microstratégie
Types des connaissances > Connaissances métacognitives

